Instructions for Using Excel
Graphs are an important part of scientific publications. While many scientists use software such as MatLab or Mathematica to produce fully customizable graphs, the most widely available software package used by students and professionals alike is Microsoft's Excel. Unfortunately, the default settings for producing graphs in Excel are pretty poor. In this section you will learn how to prepare and format graphs so that they are ready for publication.
The instructions listed here are for Microsoft Excel for Mac 2016, which is the version used on school computers. Since 2011, Excel has been using a toolbar called the "ribbon," which looks like this:
The ribbon can be minimized by clicking the up arrow to the right of the Share command. You will also be using the main menu, which appears as follows:
Example data
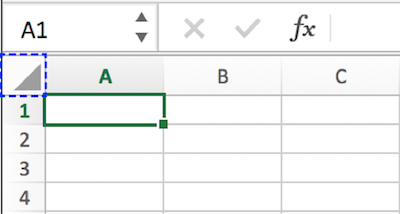
Let's start by inputting a data set with normal force in column A and static friction force in column B. Before we begin typing in numbers, change the font for the entire document to Times New Roman 12 pt by typing CTRL-A or by clicking on the Select All button shown by the dashed blue line in the picture below.
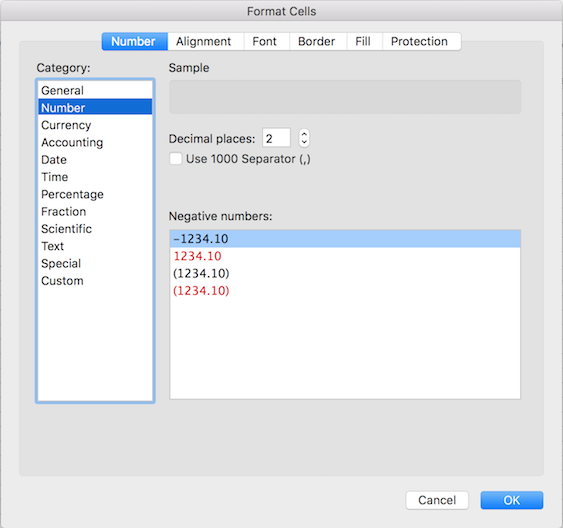
While all the cells of the spreadsheet are selected, change the font from the Calibri default to Times New Roman 12 pt (make sure the Home tab is selected). Now select the A and B column by clicking on the letter A, which selects all of column A, and shift clicking the letter B to select all of column B. Using Command-1 brings up the Format Cells menu:
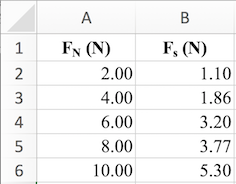
Select the Number tab at the top of the Format Cells window, then select "Number" under the Category group at the left. Make sure a "2" appears under Decimal Places. Enter the following data in columns A and B:
The subscript in the header is made possible by selecting the letter you wish to appear as a subscript, typing Command-1, and selecting the box next to "Subscript." You can also use the shortcuts Command-B and Command-E to generate bold and centered text.
Creating a Graph
Begin by clicking on the middle of cell A1 and dragging to the middle of cell B6 to select all the data. You can either use Insert, Chart, X Y (Scatter) from the main menu or click on the insert tab in the ribbon. You should see the following chart menu in the ribbon:
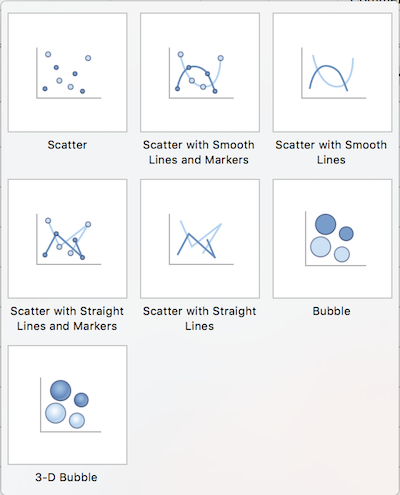
Clicking on the Scatter icon opens the Scatter menu:
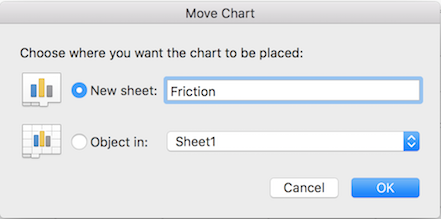
In most cases we will select Scatter (top left), whereby a chart will be generated and inserted in your worksheet. You will then need to move the chart into its own sheet by clicking on Move Chart from the Chart Design tab in the ribbon, or control-click the chart and select Move Chart from the options. You will see the following dialogue box, where you select the radio button next to "New sheet" and name the sheet "Friction." All graphs should be printed as a full page and placed at the back of your lab report.
Formatting the graph
The first thing we will do is to change the font for all graph elements to Helvetica Neue 12 pt. Make sure the graph is selected by clicking in the white space near one of the corners (don't select inside the graph itself). Then click the Home tab in the ribbon, and change the default font from Calibri 10 pt. to Helvetica Neue 12 pt. The font for axis numbers and chart title should change correspondingly. Then click the font color icon shown by the red circle below, and click on the color black to change the font color from the default gray to black.
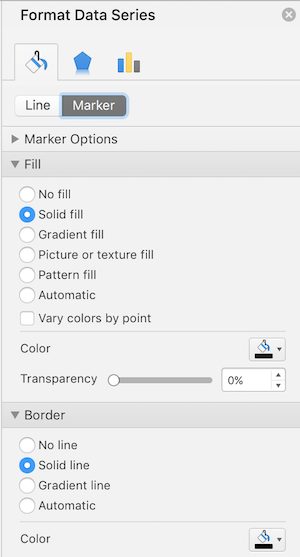
The color of the data points needs to be changed from the default blue to black. This is done by double clicking any data point, which will select all data points and cause a Format Data Series window to pop up.
First click the Fill & Line tab, then the Marker tab underneath. Under the Fill option, the color should be changed from blue to black, and under the Border option, the color should be changed from blue to black. The end result should appear similar to the picture below.
Gridlines
Get rid of the horizontal and vertical gridlines by clicking on the Chart Design tab in the ribbon, selecting the Add Chart Element, and selecting Gridline followed by Horizontal Gridline. Repeat for the vertical gridlines. Alternatively, you can select the gridlines directly and press the delete key.
Axis titles and Chart Titles
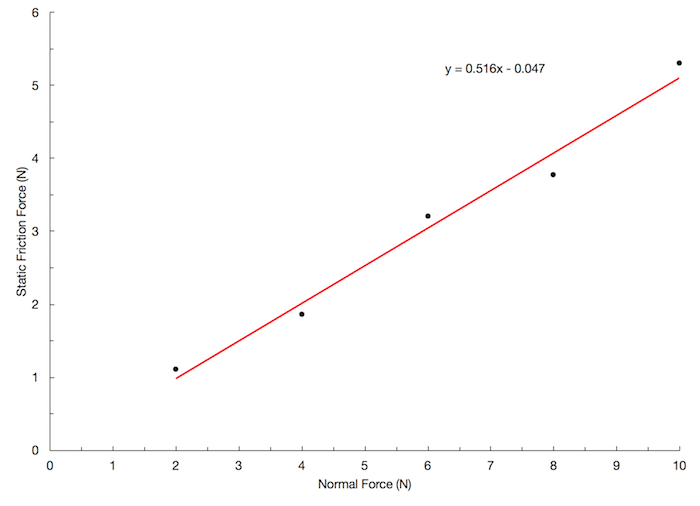
We will not use chart titles, because we plan to use figure captions underneath the graph. Select the Fs (N) chart title and press the delete key to remove it. Axis titles are required for every graph. To add a horizontal axis title, make sure the Chart Design tab is selected in the ribbon, select the Add Chart Element and choose Axis Titles, Primary Horizontal. Change the default "Axis Title" to "Normal Force (N) on the horizontal axis. Now repeat for the Primary Vertical Axis, changing "Axis Title" to "Static Friction Force (N)." Note that if your units require a superscript, you will have to manually format as a superscript using the procedure provided above. The carat ^ is not acceptable for indicating an exponent.
Formatting Axes and Tick Marks
Select the horizontal axis by selecting any number on the axis. In the Format Axis window, click on the Fill & Line tab, then under the Line Option, change the color to black. Now click on the Axis Options tab, which appears as three vertical bars in the Format Axis window. Under Axis Options, change the maximum from 12 to 10 to force the horizontal range to be from 0 to 10. Then change the major units to 1 and the minor units to 0.5. This will allow us to have major tick marks every 1 N and minor tick marks every 0.5 N. Next, open the Tick marks option and choose Inside for both major and minor tick marks. Finally, open up the Number tab and change the decimal places from 2 to 0 (make sure that Number is selected under Category). Having integers on the x and y axes will make the graph look cleaner. Repeat the same steps for the vertical axis, but change the maximum to 6 instead of 10.
Trendlines
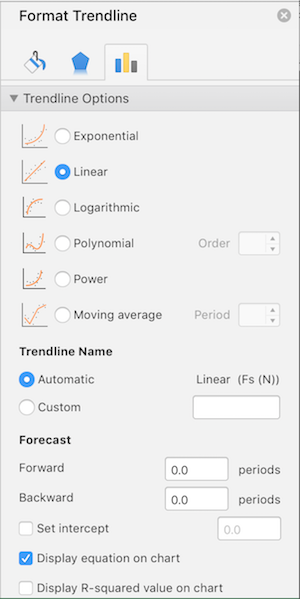
A trendline is the term Excel uses for a least-squares linear regression. We will be using the linear trendline mostly, although there are other types as well. Click on one of the data points, then make sure that the Chart Design tab is selected. Under Add Chart Element, choose Trendline, then Linear. A dashed blue line will appear through the data points. Now select the trendline by clicking on it. In the Format Trendline window to the right, click on the Fill & Line tab. Under Color, change the default blue to red (second to the left under standard colors). Then under Dash type, choose the solid line (top selection). Width should be set to two. Then choose the Trendline Option tab, which appears as three vertical bars. Select the "Display equation on chart" option. Your trendline options should appear similar to those below.
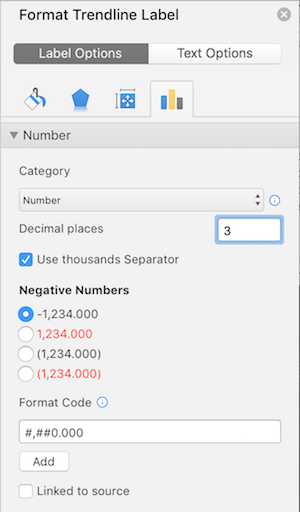
Finally, drag the trendline label (the equation) away from the data set so that it does not overlap. Under the Format Trendline Label tab, choose Number under category, and change the number of decimal places to 3, which is appropriate for this data set. Your trendline options should match those below.
Final Result
Your graph should look as follows:


